
Dual Coding in very simple terms is combining visuals/graphics with text/verbals. What it is not is having complicated pictures with lots going on next to powerpoint text and detailed drawings next to every sentence. The idea behind Dual Coding is that will reduce any cognitive load rather than put more stress on the working memory. Dual Coding if completed well should enable the memory to encode easier and so you are able to retain information in your long term memory; this in turn can be recalled during retrieval. I have written a few short blogs on retrieval practice here:
- 20 Ideas for student led retrieval practice
- 10 strategies to involve parents in retrieval practice
- 10 Research Papers on Retrieval Practice.
Much of what I have understood from dual coding has come from Follow @olicav and the following research papers:
Much of what dual coding is and can be makes sense. I have also thought while teaching that if students are writing notes while you are teaching they may miss content and lack understanding and I do not let students write notes will watching videos unless we play it twice. I now try not to overload the working memory by putting ‘complicated diagrams/ on presentations next to text as it will divide attention and I do not fill slides with pointless images that are just there to engage the learner. What is important is that the images and visuals are accompanied with text that represents the image.
I have put the following together some ideas of how you could use dual coding in your classroom. Not all of these ideas may work in your setting and will I am sure be more suited to some groups of students than others.
- Mindmaps
Students often get carried away by mindmaps – either that or never set sail only to write and colour a lovely title. If they do produce a mindmap, more often than not it is information and cognitive overload and loses its purpose. Mindmaps need to be kept simple, so students in the long run are able to self quiz using them. Set students a challenge that all branches need to be a certain colour, they must include diagrams, pictures and sketches and give them a maximum word count.
2. Annotated Diagrams
In science we use lots of diagrams to help explain concepts, ideas and phenomenon. Most if not all diagrams need further labels – but do we as teachers think hard enough as hard enough about how we label as much as what we label.
To reduce cognitive load it is important that labels are labelled within the diagram rather than attached to lines pointing to the correct parts or with labels in a box next to it labelled with a, b, c etc. There is a nice blog here explaining this with a great example by Follow @thelearningoak
3. A to Z
I have created this resource which is free to download from TES which allows for great retrieval as well as dual coding. Students use the letters A to Z to write a keyword or term for the topic of choice and then the students are able to draw or sketch something that represent the keyword.
4.Pictionary
Students write their own or are given a list of keywords. The game can be played various ways students could draw it while other guess it, or one student shows to the word to a group but can not see it themselves. Other groups members then draw it and the student that has the word has to guess what it is. The teacher could also instruct students to draw various concepts on mini white boards as a starter.
5.Story Board
Allow students to create a story board to help explain concepts. Download my template for free here.
6. Comic Strip
Similar to the story board but allow students to create their own comic strips or add text to pre-drawn comics such as these
7.Make it visual
Adding a diagram or two difficult to grasp concepts. I made a resource to support the teaching of GCSE Energy – stores and pathways. Students find this concept difficult to grasp and so I decided on creating this.
8.Put data in tables
Recently I was writing an email to colleagues regarding data entry and half way through I re-read what I had written and found it confusing. It was then, I created a table to put the data in – It took less time, made much more sense but more importantly allowed the information to be encoded a lot quicker. This is one of the reasons why we create tables in science, how else would you be able to organise thousands of data points?
9. Venn Diagrams
Organise data in a visual way – makes learning and reviewing knowledge so much easier. Mitosis Vs Meosis, alkane Vs alkene to fusion to fission

10. Timelines
Timelines are a brilliant strategy to organise dates and times that other wise would take a lot of working memory to manipulate. I have used timelines in science to visually represent the changes to the atomic model and the stages of the big band. History teachers I am sure are already all over this!
11. Infographics
I often create infographics by accident. I start off wanting to create a mind map but end up with an infographic. I see the infographic as a mindmap without the structure, but not lacking structure and information that it can be classed a poster.

12. Flashcards
I have blogged about the use of flashcards here:
and I suggest you spend 5 minutes reading this.
13. Double Bubble Thinking Maps
These are a great tool like the venn diagram if you are wanting to compare and contrast ideas. Unlike the venn digram which could be used for 2+ ideas, the double bubble would just be used to explore the similarities and differences between two things.

14. Fishbone Thinking Map
This type of analysis diagram is used when ideas can be quite complex and may cause conflict with one another. It can be seen as more structured form of a mindmap.


15. Flow Diagrams
If you have lots of ideas that are a sequence of events a flow diagram is a useful way of getting your thoughts on paper in a visual format. I have most commonly used this when I have asked lower attainers to write a method for a scientific experience, they find a flow map easier to understand than just listing instructions.
16. Foldable / Interactive Notebooks
A few years ago I started to create interactive notebooks which I noticed were very popular other in America. The aim of these foldables were that would help support students in getting to grips with concepts and ideas. the resources are far more engaging than just drawing a 2D diagram in an exercise book. These resources can be found here:
17. Visual Methods /Integrated Instruction
I have always tried before a practice to make sure I have shown students a clear demo, which is left complete and used as a reference point if possible. I will also put written instructions on the board which students can use. It was twitter that pointed me in the direction of Follow @dave2004b his brilliant blog and chemix.org
Reducing cognitive load and adding dual coding to a method can only benefit students.
18. Sketchnoting
Sketchnoting is the art of adding graphics and visuals to notes instead of writing them all in words. The Naked Scientists Follow @NakedScientists have produced some great videos in the past using the art of sketch noting and it is explained very well in this article by Follow @sarah_wright1
19. Tree Maps 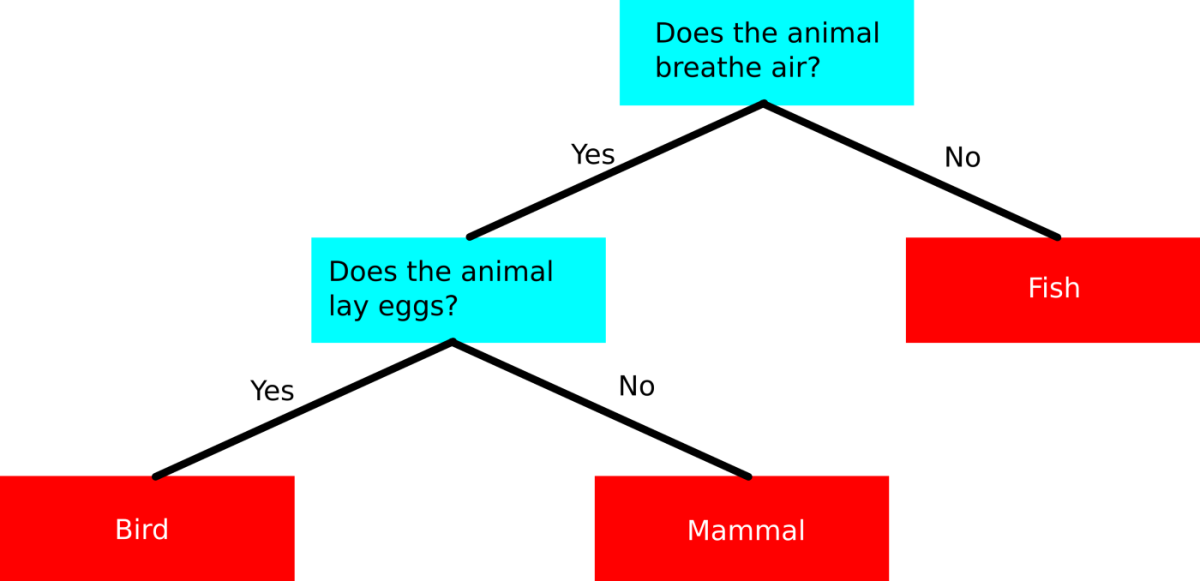
I have used tree maps in classification type activities and decision making activities. I have used examples of these in the past when teaching the rock cycle. Does the rock dissolve in acid – if yes go to A if no got B. They can be also used to classify categories such as the classic image of the kingdoms in biology.
20. Cycle Diagrams
These are created as flow maps however the steps can feed back into each other. They can make complex ideas seem connected. Examples can be like these:


For further reading click here
http://www.learningscientists.org/blog/2017/2/5/weekly-digest-45
14 Research Papers on Dual Coding
Kate Jones Follow @87history has a brilliant overview and more links to dual coding which you can find here.
Any more ideas to add – let me know on Twitter.
Follow @TJohns85OliCav has written this great book. Buy a copy here – click on the book image.

Image Google images: Commons; label for reuse but with thanks to Follow @P_A_Kirschner & Follow @MirjamN

I hadn’t come across Paivio’s work before so thank you for that.
I was wondering why you had described it as Pavio’s Dual Coding since I only knew Mayer’s work, so I’ve had a read of his 91 paper. Based on this bare minimum of expertise I feel like you’ve conflated two theories. I reckon that one, Paivio’s, says that long term memory can be coded in words or pictorially and we remember better where there are associative structures between the two, and this seems to be the basis for most of your 20 ideas? Then there’s Mayer who, as your diagram shows, says there are verbal and non verbal buffers in Working Memory and so effective WM be expanded via instruction which has both speech and diagrams.
Am I wrong?
LikeLike